

 Previous

[This article was prepared with input from Jeff Knezovich, OTT’s Editor at Large. It is part of a series on monitoring, evaluation and learning for think tanks. Other articles posted so far include a case study of monitoring, evaluation and learning in a South African think tank by Tracey Phillips; and an piece on The Research Quality Plus (RQ+) Assessment Framework by Zenda Ofir]
Monitoring and evaluation – M&E, or MEL as it has come to be known, the ‘L’ standing for learning – has a bad reputation. It’s difficult. It’s boring. Pulling all the information together takes f-o-r-e-v-e-r. Plus, we only do it because there’s a board meeting coming up or because a donor asks for it.
MEL needs a rebrand. By design, public policy research is aimed at change. It is basically unfinished unless key findings are packaged and disseminated so that they have a chance to feed into the policy debate. To influence some sort of positive change. With this in mind, tracking the impact of research, or at the very least understanding who is accessing it and how, should be a regular part of what thinktankers do.
Lauren Gelfand, Director of Policy Engagement and Communications at the African Population and Health Research Center, puts it another way.
We [think tanks] don’t necessarily spend nearly enough time or resources tracking where our work has landed. That does us a disservice as it prevents us from truly understanding our impact and where there are opportunities to broaden that impact or demonstrate the value of our thinking and analysis.
Of course, just doing a lot of monitoring, and only using this data to satisfy donor requirements or for annual reports, is a real missed opportunity. The main benefit of MEL is the learning part. It is about using what you gather to tweak your dissemination approaches, to prioritise your output types and to troubleshoot when things go a bit wrong.
Read more about Monitoring, Evaluation and Learning:
- Four questions to assess your research communications impact
- Notes on methods and collaboration: Creating an online survey to assess think tanks’ performance
- A monitoring and evaluation activity for all think tanks: ask what explains your reach
- Research uptake, what is it and can it be measured?
A lot has been written about the range of tools available to track communication outputs. This piece pulls some of them together nicely, and explains how they might be integrated into an M&E dashboard. Other articles have been written to help communication staff understand the range of new metrics that have emerged in light of the growing use of Twitter, Facebook and other social media platforms. What is the difference between ‘reach’ and ‘impressions’, for example? A wealth of information also exists to help think tanks structure their M&E, including Louise Ball’s blog on the broad questions you should be asking when trying to frame and measure research communication impact.
But what should you do if you’re a small think tank without much capacity? What if you don’t have a full-time communication person, let alone a communication team, like the bigger think tanks do? What if your director isn’t that interested in monitoring, evaluation or learning? To help answer this, it is important to start seeing MEL as integral to every part of your research and communication, not just something that gets tacked on at the end.
I’ve worked with a range of think tanks and research institutes in Europe, Latin America and Africa. Here’s what I tend to advise, especially for those with limited capacity and funding:
1. Be crystal clear about what you’re going to measure and why
The first step is to be clear about what you want to measure. The easiest way to do this is to look back at your organisation’s strategic aims or policy influence objectives. You’ll also have to take note of what your donors want, of course, but try to integrate what you need to gather for them into your overall tracking to be as efficient as possible.
This is important, not just because it is good to have a clear goal, but because different think tanks try to influence policy in different ways. Some focus on big campaigns that aim to affect a specific policy change (the advocator). Others are more interested in ensuring that certain side-lined voices are included in policy discussions (the convenor). What you decide to measure will depend a lot on what kind of influence your organisation is trying to have and how they are seeking to have it.
If your organisation is more of a convenor, then spending loads of times trying to find your organisation’s name in press cuttings might not be a good use of time. Journalists don’t usually mention the organisation that created the ‘space’ for discussion and debate. They quote the person who gave them the juicy soundbite. A focus on media monitoring might give the impression that your organisation isn’t having any impact at all. It would be much more useful, both in terms of monitoring and learning, to focus on who came to your event (numbers, types of organisations, gender breakdown, etc.) and how many people accessed the meeting output (podcast, meeting report, etc.). This sort of tracking allows you determine whether the right people are at your table, who you might want to bring into the fold and how you might do that.
2. Don’t do anything too fancy to begin with. Pick a couple of indicators and use simple tools to track them
As mentioned above, there are a lot of tools you can use to track a lot of different things. It can be overwhelming. To keep things manageable, stick to just a few. While what you choose to track and which indicators you use will vary, the most useful things for those new to MEL are as follows:
| Indicators | Why it is useful |
| Contacts on database (broken down by organisation type, topic of interest, location, activity level) |
|
| Website traffic (including visitors, views, downloads, listens) |
|
| Event engagement (who registered, who attended, who livestreamed, who viewed the invite) |
|
| Media engagement (who is on your list and what type, number of media ‘hits’, number of enquiries) |
|
In addition to what I’ve listed in the table above, a lot of which can be gathered automatically using analytics and database software, I usually suggest one more thing: an outcomes log, or what some prefer to call an impact log. This is a place to put the formal and informal feedback that doesn’t really have a place. It can be done using a simple Excel sheet. The great benefits of an impact log and what it looks like in practice are outlined well in this SlideShare.
3. Have a regular meeting that focuses on learning and future strategy
Next, present your data in a visually engaging way that helps demonstrate trends or peaks (charts work well). Your presentation should be no more than 15-20 minutes long and should conclude with a few top line observations or questions to encourage discussion. Use the remainder of the session to focus on brainstorming ideas to refine future dissemination and fix any issues that may have been highlighted. Where possible, link the conversation back to your strategic objectives. You’ll find that the discussion gets quite lively. I’ve even experienced researchers getting a bit competitive, especially when you report the download numbers of different publications. The sorts of things that come up in these meetings include:
- Why did policy brief X do so much better in terms of downloads than policy brief Y?
- Why did so many journalists attend our event on South Sudan in December?
- Why aren’t there many NGOs on our mailing list? They are a key audience for project Z, so we need to increase our numbers.
- Should we test two different versions of our newsletter to see which gets the most click throughs?
- Should we invest in getting some media training since our engagement with journalists is quite poor?
These meetings should happen once a quarter, with important decisions captured quickly in a short note. Report progress against key action points at the next meeting, if not before. This gets people really invested in the process, especially if tangible differences can be shown, which they inevitably can.
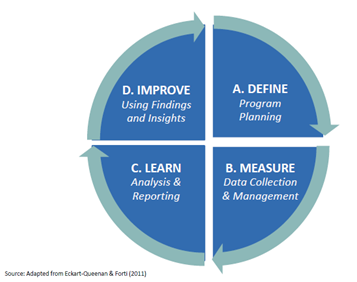
Though MEL can be daunting and time consuming, it is in fact one of the best ways to help think tanks achieve the greatest impact in the most cost effective way. As long as the data is put to use, that is. Most businesses have ‘business insights’ tools that they use every day to help them target customers better and refine their marketing approaches. Just because you’re trying to sell ideas, rather than products, doesn’t mean you should ignore these sorts of tools. So, start small, focus on your priorities and – most importantly – make sure that you actually use of all that information you’re gathering. Repeat after me: define, measure, learn, improve. +