

 Previous

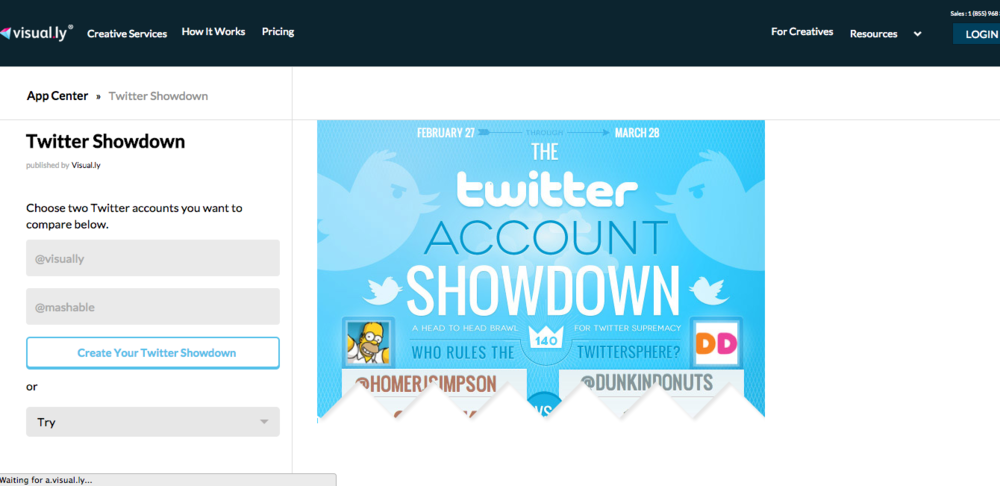
Although primarily an online marketplace for infographic designers, Visual.ly has a Create option which allows you to make simple graphics through your social media accounts.
What it’s best for
- A simple tool for basic graphics, useful for social media
- Can create infographics based on Google Analytics reports, Twitter, LinkedIn, and Facebook, and has simple templates for CVs and resumes.
- A useful source of inspiration – both good and bad! A great place to research potential ideas and bone up on good visual design.
Where it falls down
- Inflexible results – limited to a few types of templates
- Cumbersome to use – you have to log in with each type of social media in order to create a new graphic
Costs*
The data visualization tool is free, but you can pay for custom designed infographics, ebooks, presentations, videos and interactive web experiences from professionals at a set price ranging from $560 – $10,000.
* Costs are correct at time of publication. Please always refer to original website for current pricing.