

How do you define success in research communications efforts? + Clearly, if policy influence is the name of the game, then evidence of communications having played a role in policy change is an appropriate barometer. Trouble is, there are a number of conceptual, technical and practical challenges to finding evidence, and being able to use it to measure the success of an individual or organisation. There can be occasions when communications staff can show they played a role: perhaps someone has organised a series of meetings with policy-makers as part of a communications strategy, or the media have picked up a new report pushing an issue to the top of the policy agenda. However, given the complexity of policy cycles, examples of one particular action making a difference are often disappointingly rare, and it is even harder to attribute each to the quality of the research, the management of it, or the delivery of communications around it.
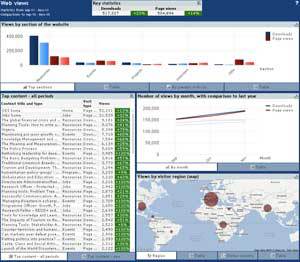
I have recently created a monitoring and evaluation (M&E) dashboard to track how ODI outputs disseminated through our main communications channels fare. This brings together qualitative and quantitative data collected digitally, including a range of data available from new digital tools used on our website and online. In this blog, I outline some of the lessons I’ve learnt in the process of creating the dashboard and investigating the data, a framework I’ve developed for assessing success, and list some of the key digital tools I’ve encountered that are useful for M&E of research communications. If you’re only interested in the tools and applications, please do jump right to the end for the list.
The M&E dashboard builds on previous ODI work on M&E of policy influence to provide an overview of how research communications work for the organisation, and its programmes and project teams. To try to give full picture, I’ve included data that could give insights into the quality and management of research, as this can sometimes be the reason for the success or failure of communications – if the research being communicated is of low quality it may be harder to achieve success, or any success may be counter-productive as it can damage reputations and brand. My aim is to create a set of benchmarks for the organisation, to be able to assess success in reaching and influencing audiences, identify what factors led to that success, and act upon the findings. In particular, I want to use this information to inform future communications actions and strategies.
Be pragmatic, part one: only measure what you can measure
Digital tools do not offer a panacea for the measurement of policy influence: it is unlikely that tools will ever be available that can report on exactly who is reading or engaging with particular pieces of content, what their jobs are, their specific role in policy and their intellectual reaction to any content they read. If anything, the current direction of change is moving further away from this: Google recently updated the way it reports on searches to remove very useful data on keywords due to concerns that this could identify the searching habits of individuals and infringe on their privacy.
In lieu of specific insights into how communications play a role in policy cycles, what can you do to measure research communications reach and efficacy? A few years ago, Ingie Hovland of ODI proposed five levels to assess policy influence efforts. Many of these levels apply directly to research communications and, taken together, they offer a framework for assessing the success or otherwise of research on policy debate and processes – a useful barometer of success where the evidence of direct impact and policy change is hard to come by or define. The levels are:
- Strategy and direction: The basic plan followed in order to reach intended goals – was the plan for a piece of communications work the right one?
- Management: The systems and processes are in place in order to ensure that the strategy can succeed – did the communications work go out on time and to the right people?
- Outputs: The tangible goods and services produced – is the work appropriate and of high quality?
- Uptake: Direct responses to the work – was the work shared or passed on to others?
- Outcomes and impacts: Use of communications to make a change to behaviour, knowledge, policy or practice – did communications work contribute to this change and how?
The assessment levels are generally cumulative too, so success at level 5 implies some element of success at levels 1 to 4.
By bringing together different statistics from a number of sources, our M&E dashboard aims to help in the development and evaluation of the first of these levels – strategy and direction – by providing benchmarks for planning and assessing success at the remaining four levels. Examples of statistics and information that can be gleaned from digital systems and used for different types of communications work include:
|
Assessment level and potential information to benchmark |
||||
| Mgm’t | Outputs | Uptake | Outcomes & impacts | |
| Website | A good split of sources for web entrances (search engine v. email and other marketing v. other sites)
Number of website visitors |
Website survey, such as 4Q
Search engine positioning |
Click of ‘Share’ button on home page
Social network mentions of site as a whole Subscribers to news feeds |
Evidence sent to M&E log from emails or personal contacts |
| Publi- cation | Number of downloads
Split of web entrances (search engine/ email / other sites) |
Feedback survey
Search engine positioning – keyword analysis Clicks of ‘print’ button Number of publications produced |
Citation tracking
Social network mentions Clicks of ‘share’ button |
|
| Blog or article | Number of webpage views
Split of web entrances (search engine/ email / other sites) |
Comments on blog
Search engine positioning Clicks of ‘print’ button |
Comments on blog
Social network mentions Clicks of ‘share’ button Placement on media site or media mention |
|
| Event | Number and type of contacts receiving invitations
Number of dropouts (people who register but don’t attend) Web visits to event page Split of web entrances (search engine/ email / other sites) |
Number of registrations and dropouts (people who register but don’t attend)
Views of catch-up video Feedback survey Online chat room comments |
Clicks of ‘share’ button
Social network mentions Feedback survey |
|
| Media release | Number of contacts on media release list
Subscribers to media news feed |
Number of media mentions generated
Logs of follow up calls from media contacted |
New sign-ups to media release contact list
Logs of follow up calls from new media outlets Subscribers to news feeds |
|
| News- letter | Number and type of contacts receiving newsletter | Number of click-throughs from items
Number of people unsubscribing |
New subscriptions to newsletter
Forwarding of newsletter Social media mentions |
|
| Organ- isation | Collation of the above, plus number of social network followers, overall number of contacts | Collation of the above, plus overall number and type of outputs | Collation of the above, plus indicators of social network influence (e.g. Klout) | Collation of the above |
In the table above there is a reason why the rows are split into output types – this is the level at which action based on analysis can most easily be taken. At this level, a communications planner can better choose the right platforms for achieving engagement on certain topics, decide on a case-by-case basis where to post blogs, how and where to advertise new papers, and what to spend money on. Collating all actions taken for each output produced by a programme or organisation and the results of these should provide evidence of organisational progress.
Be pragmatic, part two: don’t measure everything you can measure
Even if you stick to assessing and taking action on only those things that are measurable, it is important to avoid over complication by being quite picky in what you do and don’t include in any dashboard. The number and types of statistics that can be tracked is huge after all. Google Analytics, for example, tracks hundreds of different pieces of information for every page viewed. If you track too many things it will be hard to see the wood for the trees and single out the messages from your statistics. Equally if you choose the wrong statistic, the message won’t even be there to see.
When deciding what to include in the dashboard, I had to think carefully about how these statistics were going to be used. As the aim of the dashboard is to provide insights into trends for the viewership, usage and engagement with communications products, I chose specific statistics that would tell this story. So for Google Analytics, I report only on two key metrics to give me an overview:
- unique page views – number of times a page has been visited by a unique person and details on the country that person was in.
- entrances – number of arrivals at the ODI site, which page they arrived on and how they came to our site.
If I identify trends within these metrics I can log into Google directly to look at the data in more detail.
It is also important to know whether you’re getting the full picture for a set of statistics or not, to avoid skewing your tools. For example, it is hard to get accurate information on retweets and tweets because of use of link shorteners to make a web address smaller. To get complete Facebook ‘share’ or ‘like’ stats is also impossible due to the privacy settings of those who share information. Other platforms don’t offer statistics as a matter of principle due to their ownership – for example, it isn’t easy to get information on visits to a blog placed on a top media site because this information isn’t generally shared (being commercially sensitive). Finally, even the platforms that do offer statistics easily and openly do so in various different formats, making it hard to tie them together. So the format for Youtube views is completely different to that for Slideshare or other online tools. In all these cases, it is a matter of doing the best you can. I have included some tools at the end that can help in a number of these cases.
Be pragmatic, part three: don’t let the need to measure get in the way of a good communications strategy
I’ve talked on this blog before about how the rapid rise of Facebook and social networking sites could change online dynamics and make dissemination (‘being heard’) more important to being found than just having a website available through Google. If you accept this argument and concentrate efforts on dissemination through the wider internet rather than your own site, the theory is that you should improve your chances at policy influence. However, you will also make recording your success much harder.
The need to measure has already led the research communications industry down what I believe is a flawed path. Many organisations are content with reporting on absolute website usage as a proxy for influence or share of the ideas market. In a world of uncertainty, where the efficacy of different research communications and policy influence efforts are hard to measure, funders have also latched on to page views and file downloads (the metrics of website usage), and insist that these are reported regularly as part of project plans. This provides data that can be compared with others and monitored for improvements. Unfortunately, these are possibly some of the least useful metrics of success that could have been chosen, as growth in these figures is almost guaranteed, due to a wider dynamic – the rise in Internet usage itself.
The fact is, there are times when measuring the success of what you intuitively believe to be a good communications strategy is going to be hard. It is for this reason that the assessment levels above, and particularly levels 4 and 5 (uptake and impact), make greater use of qualitative data. Our M&E log is a central way of trying to collect information on impact that might be harder to collect any other way – a central repository where evidence collected from emails, mentions in media or blog articles, praise on Twitter or other social networks can be sent quickly and easily for analysis.
Some tools we use
I’ll say it again: M&E of research communications isn’t easy. I strongly suggest organisations wanting to improve their M&E take time to find the right approach. This shouldn’t stop them from starting to collect data in various ways that can be interrogated later, however. This is the approach I took at ODI, with some statistics being collected for a couple of years without much analysis while ways in which to use them were thought through.
- To track webpage statistics, Google Analytics is pretty much the industry standard and can be installed through a small script on the site. However this doesn’t track downloads properly – for this you need to interrogate server logs. There are thousands of applications that do this, but I use Weblog Expert because it is fairly cheap and powerful enough to get what I need out of it. You can also estimate page views on a site other than your own with Google Trends and StatBrain.
- To get an overview of search engine positioning, sign up to Google Webmaster Tools.
- Organisations with RSS news feeds would do well to run them through Google Feedburner to see how they’re be used and by whom.
- Twitter statistics can be found through numerous different tools – I’ve used TwitterCounter to get some raw statistics, and Klout to get an idea of how ODI is doing in terms of influence. Klout also works with Google+, if you’re using it. If you want to see how many times a particular page has been tweeted then enter the address into Topsy and you should get a good idea.
- Facebook is easier than the rest as they offer built-in tools for analysis through Facebook Insights.
- For a simple survey of website users that is easy to install and gets key data on how people are using your website and what they think of it, I can’t recommend the free 4Q tool highly enough.
- If you don’t already have a mailing list system, MailChimp is one of the best around and allows you to do a lot of analysis of contacts.
- To track media and blog mentions Google Alerts is great – but there are also alternatives such as Social Mention.
- Academic citation analysis is hard and therefore generally very expensive, however a tool that uses Google Scholar, such as Publish or Perish, offers a lot to get on with. Note, however, that due to the nature of journal publishing processes, it takes a long time for academic citations to start coming through so this is a long-term activity.
- How you implement an M&E log is down to you. At ODI we run it through our intranet, built on Microsoft Sharepoint, but you could use a survey tool to do it, such as Survey Gizmo, or even something like a Google Docs spreadsheet with an attached form.
- Finally, organisations ready to make the leap and start bringing all of this data together in a dashboard need to think about what software or site to use to present and interrogate data. ODI uses software called Qlikview, but this is probably only for much larger organisations creating a lot of outputs every month. Online alternatives include Zoho Reports, Google Docs or Google Fusion Tables.