

 Previous

[This article was originally published in the OTT Annual Review 2019-2020: think tanks and technology on March 2020.]
At Soapbox, we pride ourselves on driving communications forward in the think tank sector. In recent years that has meant a lot of focus on digital communications – helping think tanks build better websites, leading the charge towards modular content, and helping researchers think in terms of outreach campaigns, not just research reports.
These days, we get really excited talking about things like nonlinear content, voice search, and decoupled content management systems.
It’s cool stuff!
The Next Big Thing comes at us so fast, and it’s so easy to get caught up in all the new things technology allows us to do, that we forget about one of the most important advantages technology offers: the ability to do old things better.
A recent conversation captures this sentiment nicely. While lamenting some web publishing processes, a client quipped, ‘I didn’t go to university to cut and paste!’
Ever since, we’ve been trying really hard not to think about how much of our professional careers have been spent cutting and pasting.
Overcoming repetitive tasks: a case study
Our work with the International Budget Partnership (IBP) is a textbook example of using technology to produce existing products more efficiently.
Every two years, IBP produces the Open Budget Survey, ‘the only independent, comparative, and fact-based assessment of government budget accountability’. This year, 117 countries were included in the survey. The new edition, which we designed and built, will be published in April 2020.
IBP analysts compile and carefully review detailed responses from almost 300 researchers worldwide, feed their analysis into some complex algorithms, and derive a set of scores for each surveyed country. IBP then produces a summary for each country, along with a longer report that explores global trends.
Summary data includes document scores, charts examining scores over time and across countries, as well as narrative descriptions and recommendations. The narrative descriptions and recommendations are nearly all data-driven – if a country scores between 0 and 40 on ranking A, then insert recommendations A and B; if it scores between 41 and 80, then insert recommendations C and D; if it scores between 81 and 100, then insert no recommendations.
The old way of doing things
Last time round, IBP used Word templates and Excel spreadsheets to create each summary individually. The spreadsheet provided the relevant scores, and the Word template explained which text to include based on those scores. Each Word document was then pulled into Adobe InDesign to create a PDF version for print. The Word document was also pulled into the content management system to create a digital version.
You can imagine the amount of effort required. And you can also imagine the consternation if the text of a recommendation needed to change. It meant searching all the Word documents to find all instances of the recommendation, making the change, then uploading all instances of the change individually to InDesign and the website.
A better way
Phew!
We worked with IBP to automate most of the country summary process.
We began by creating a templating system inside a new content management system. It begins by importing the Excel sheet directly into IBP’s content management system.
The system has several layers.
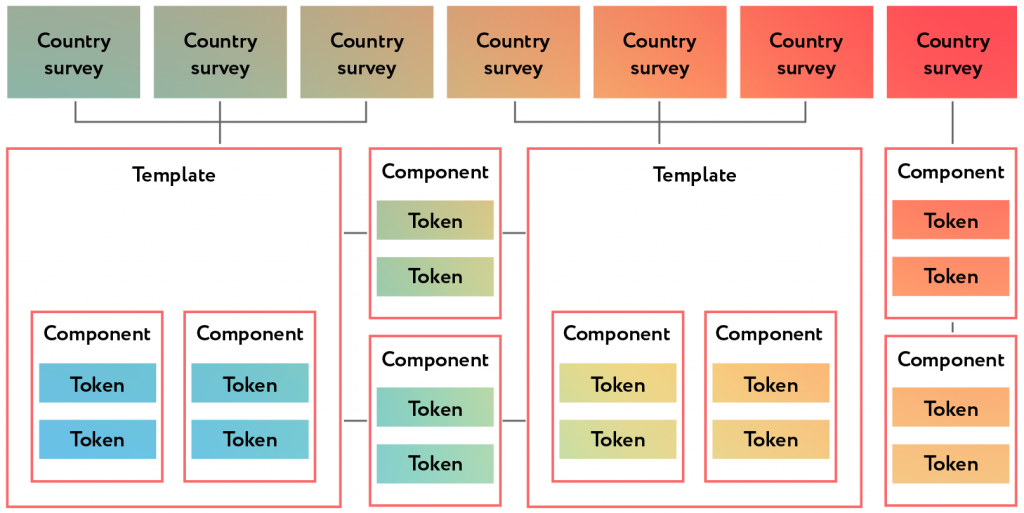
At the lowest layer is a set of ‘tokens.’ Tokens work much the same way as variables do in an equation. Some tokens are simple, for example the name of a country. But tokens can also be quite complex, spitting out different pieces of text based upon meeting certain conditions.
For example, IBP can define a token that inserts the word ‘inadequate’ if a score is below 40, ‘insufficient’ if a score is between 41 and 60, ‘sufficient’ if a score is between 61 and 80, and ‘excellent’ if a score is between 81 and 100.
At the second layer are components. These can be static text or combinations of static text and tokens.
For example, a sentence reading ‘Wakanda’s transparency score of 57 is substantially higher than its score in 2017’ would be a component consisting of static text plus two simple tokens (‘Wakanda’ and the number 57) plus a complex token (the words ‘substantially higher’, which is calculated based on the score).
At the top layer is a template. A template is a collection of components. A full template will display a complete country summary.
There are additional layers of flexibility built in. In IBP’s specific case, there are some sets of countries that need significantly different components, even though they still share some common elements. So, their system allows for the use of common components that are shared across templates along with template-specific components.
Once the templates are built, IBP can upload the Excel sheet containing all the country data (the same sheet they used to use with Word documents). The content management system will then create all 117 country summaries, automatically selecting the correct text based on the specified values. If IBP needs to change a recommendation later on, they simply change it in the component and it immediately propagates to every summary that uses that component.
A page-to-PDF functionality then produces printable versions of each summary directly from the online version.
The results
The site uploads a new spreadsheet and populates all countries in a matter of seconds.
Previously, IBP staff needed an hour or more to create each summary. Staff also spent somewhere between 30 minutes to an hour uploading web versions of the country summaries. Conservatively, that’s close to 4.5 weeks of staff time saved, and that’s before considering the hundreds of collective hours spent editing and revising both Word and InDesign files. In addition, IBP paid an external designer to create the InDesign versions of each summary.
Now, using a third-party processing tool, the content management system generates all 117 country summary PDFs in around five minutes. The cost of those five minutes of processing time is around one US dollar.
If a task is repetitive, a machine probably does it better
It may sound a bit like a cliché, but for think tanks, your people are your best – and scarcest – resource. There’s a finite number of things a team can accomplish. Every hour we spend cutting and pasting is one that is not spent conducting new analysis or meeting with a policymaker or creating a new infographic or speaking to a reporter.
Machines aren’t going to replace think tank staff any time soon. The best algorithms can’t pull meaning out of data, can’t form relationships with policymakers, and can’t turn research into policy recommendations. But they are way better than humans at doing the same mechanical stuff over and over.
Of course, building systems that automate repetitive tasks and training people to use those systems requires an investment of both time and money. But once created, these systems will remain in place, saving time and money for years to come.
What does all this mean for think tank communications?
Do any of these sound familiar?
- We’d love to do more targeted outreach, but no one has had the time to investigate/build/learn our customer relationship management software.
- [Current event] was a perfect opportunity to write an op-ed about our latest research, but we didn’t have anyone available to write it in time.
- We started a podcast/video series/event series, but [staffer] left and no one else had the capacity to keep it going.
- We rotate our Twitter account between the whole team, but most days we’re too busy putting out fires to really post anything.
The Internet has opened up a thousand new ways to communicate with people. Unfortunately, the one thing it hasn’t done (at least so far) is clone staff. So, we’re left with the same number of people trying to do ten times as many things.
The trouble is that we’re often doing those old tasks in the same way we’ve always done them. We think about all the new avenues technology opens up, but don’t always give much consideration to the ways that it can make the old things far more efficient.
Producing the right content for the right people at the right time requires talented, creative people. Those people are already sitting in your offices.
They shouldn’t be spending their days cutting and pasting.